Sounds of the Spectrum
Using atomic spectra data from the National Institute of Standards and Technology (NIST), we retrieved the five most intense spectral lines in the visible range for each element. Using an algorithm, the frequency of each line was proportionally shifted into an audible frequency with each line’s loudness corresponding to its intensity. In this way, we were able to change the unique signature of each element from a frequency of light into a frequency of sound. Here is the audio for nitrogen as an example.
| The Sound of Nitrogen.mp3 |
Kramida, A., Ralchenko, Yu., Reader, J., and NIST ASD Team (2015). NIST Atomic Spectra Database (ver. 5.3), [Online]. Available: http://physics.nist.gov/asd [2017, July 22]. National Institute of Standards and Technology, Gaithersburg, MD.
By applying this technique, we obtained a library of sounds corresponding to the elements of the periodic table. These elements are the building blocks of everything, so we can obtain audio representations of things like water, the human body, rocks, the Earth, and even the universe itself! Water, for example, is ⅔ hydrogen and ⅓ oxygen by atomic percentage, so we layer the audio for hydrogen and oxygen and change the volumes so that they matches these percentages.
We then asked the question: what else can we do with this elemental sound library? Our philosophy was to explore the various ways we could represent the universe. This led us to using a Chladni Plate to reveal patterns in the frequencies. A Chladni Plate is a metal sheet that can be made to vibrate at a particular frequency. When covered with a fine grain material such as salt or sand, the grains gather at nodes (areas on the plate of low vibration) and are displaced at anti-nodes (areas of high vibration). This gives us a visual representation of the frequencies and the patterns they make.
We then asked the question: what else can we do with this elemental sound library? Our philosophy was to explore the various ways we could represent the universe. This led us to using a Chladni Plate to reveal patterns in the frequencies. A Chladni Plate is a metal sheet that can be made to vibrate at a particular frequency. When covered with a fine grain material such as salt or sand, the grains gather at nodes (areas on the plate of low vibration) and are displaced at anti-nodes (areas of high vibration). This gives us a visual representation of the frequencies and the patterns they make.
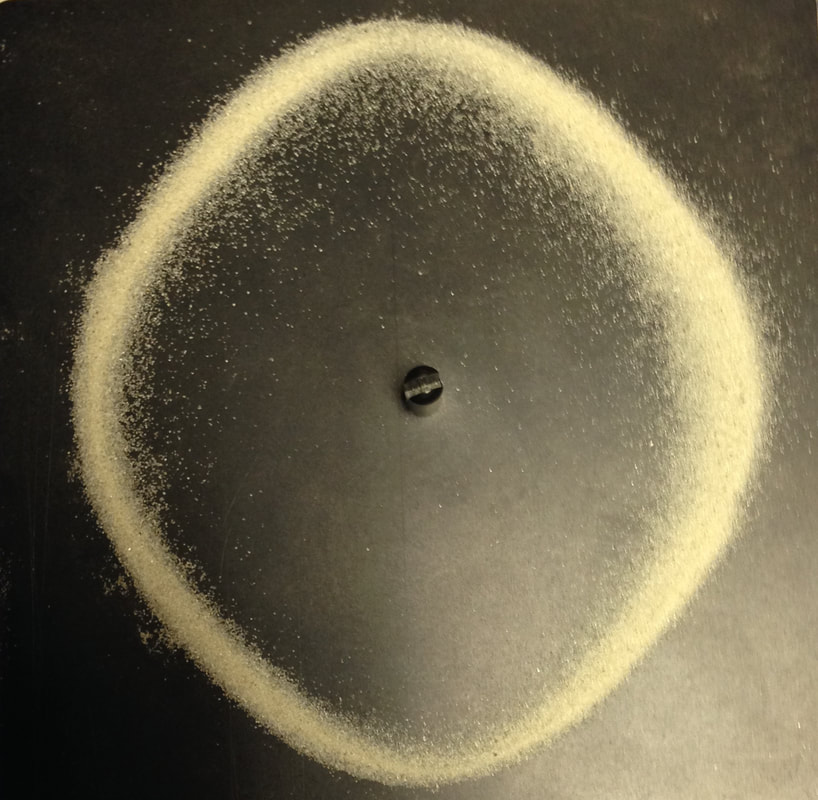
OXYGEN 261.8 Hz |
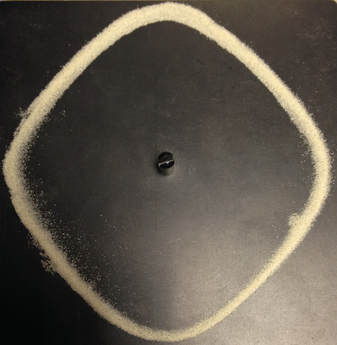
OXYGEN 303.0 Hz |
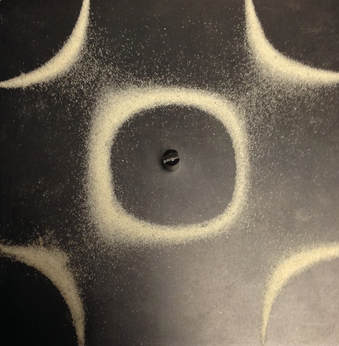
OXYGEN 598.7 Hz |
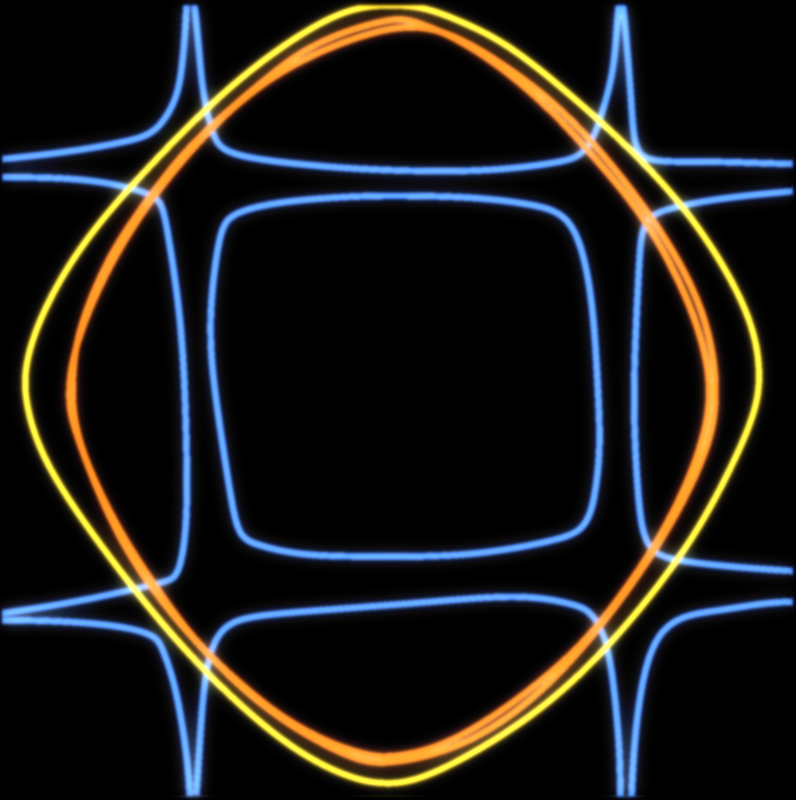
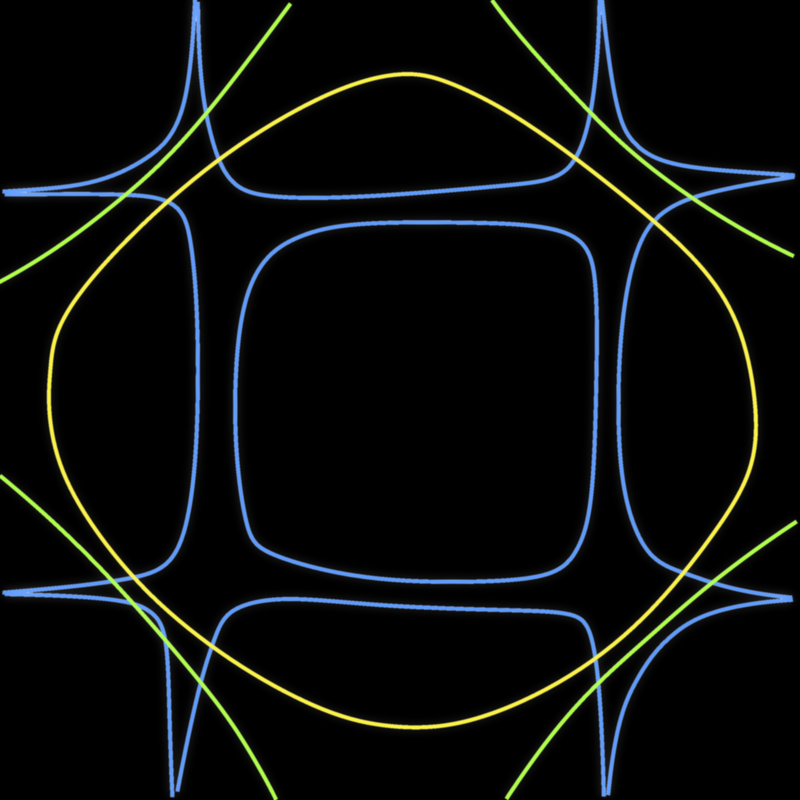
We then used a vector drawing program to trace the patterns and create digital visuals. The lines are colored qualitatively with red denoting lowest frequencies, violet denoting highest frequencies, and the other colors for everything in between.
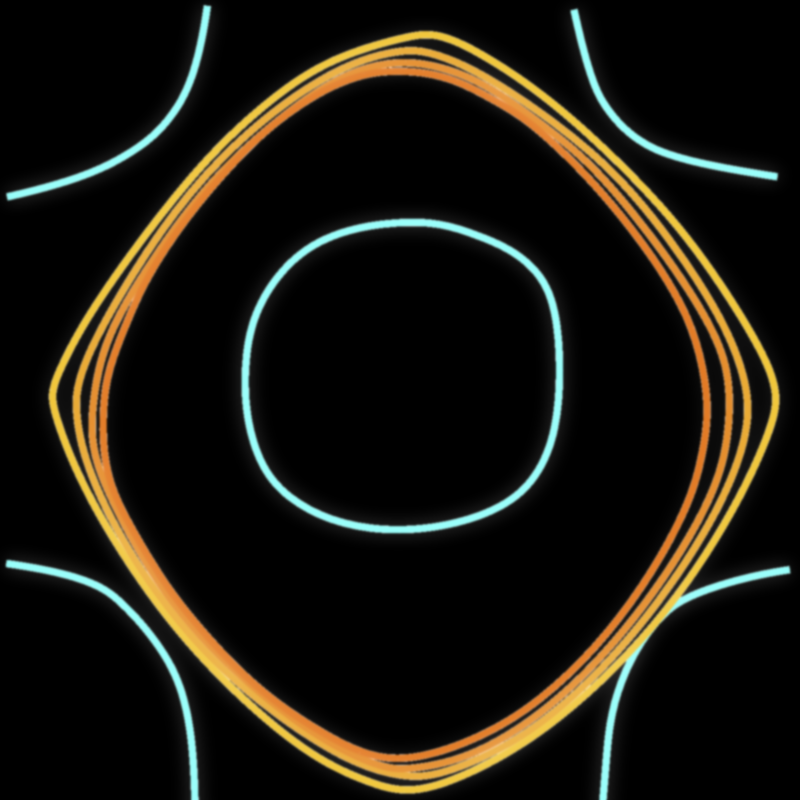
OXYGEN
|
CARBON
|
HYDROGEN
|
The human body is comprised of Oxygen (24%), Carbon (12%), and Hydrogen (62%) by atomic percent. We can stack the images and change the opacity based on the relative amounts. This gives us a Chladni Plate visual in addition to the audio representation of a human.
Reconstructing a Star
In order to better understand the chemical composition of a star, we needed to run simulations. Luckily, Richard Townsend, a professor at University of Wisconsin-Madison, has made a star formation simulation available at the following website: http://www.astro.wisc.edu/~townsend/static.php?ref=ez-web. By specifying initial parameters for the star like its initial mass, initial metallicity, and maximum age, we can simulate the evolution of a star and track different elements which form within it. An initial star of 10 solar masses and initial metallicity mass fraction of 0.03, for example, will evolve for 2.42E+07 years, at which point its chemical composition will look like the following:
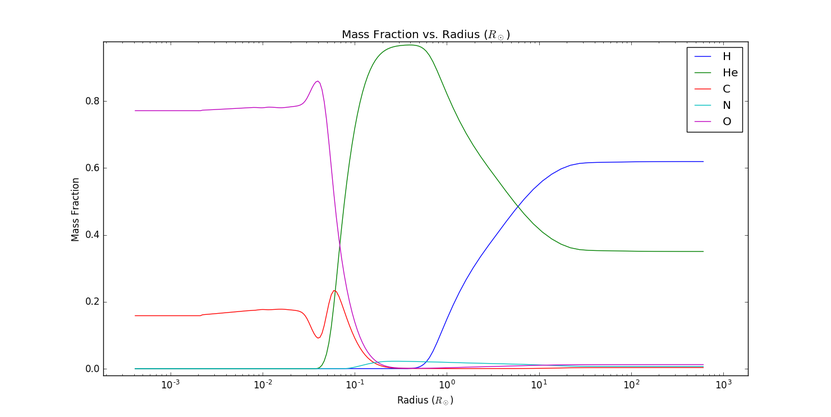
Note that at the center of the star, we have our highest concentrations of Carbon and Oxygen. A star fuses elements in its core, and so as it evolves we see heavier and heavier metals in the core. If the star goes supernova, these elements will explode outward and scatter through the universe. We also see that at the outer radius of the star ~2/3 of the gas is Hydrogen, while ~1/3 is Helium.
With this data and our sound library, we can represent the combination of elements at every point in a star!
With this data and our sound library, we can represent the combination of elements at every point in a star!
Get the Code
Interested in the work we're doing? Get the code to start playing with the sounds of the elements yourself. The first file runs in iPython while the second uses Supercollider, a programming language for sound manipulation.
Note: These scripts require the installation of Open Sound Control (OSC), a messaging interface between Python and Supercollider.
Note: These scripts require the installation of Open Sound Control (OSC), a messaging interface between Python and Supercollider.
| pythonsc_comm.ipynb |
| pythonsc_commtest.scd |
